
The silt density index measures how quickly low-turbidity feedwater plugs a specified 0.45-micron membrane under controlled pressure. For reverse osmosis engineers, SDI provides an indication of particulate matter and an empirically correlated indicator of particulate fouling tendency. Engineers often first notice a problem when RO differential pressure creeps up between cleanings, only to trace it back to a feedwater shift that a clean turbidity reading never flagged.
During system design or troubleshooting, SDI provides a repeatable basis for comparing source conditions with pretreatment performance. Rising values can reveal changing feedwater quality before the RO train develops higher differential pressure or reduced permeate output.
Interpretation depends on the test method and measurement interval. ASTM D4189 defines the controlled procedure, and SDI15 expresses the calculated plugging rate across 15 minutes. Together, the method and result support decisions about pretreatment configuration, cartridge loading, and operating response.
What Silt Density Index Measures
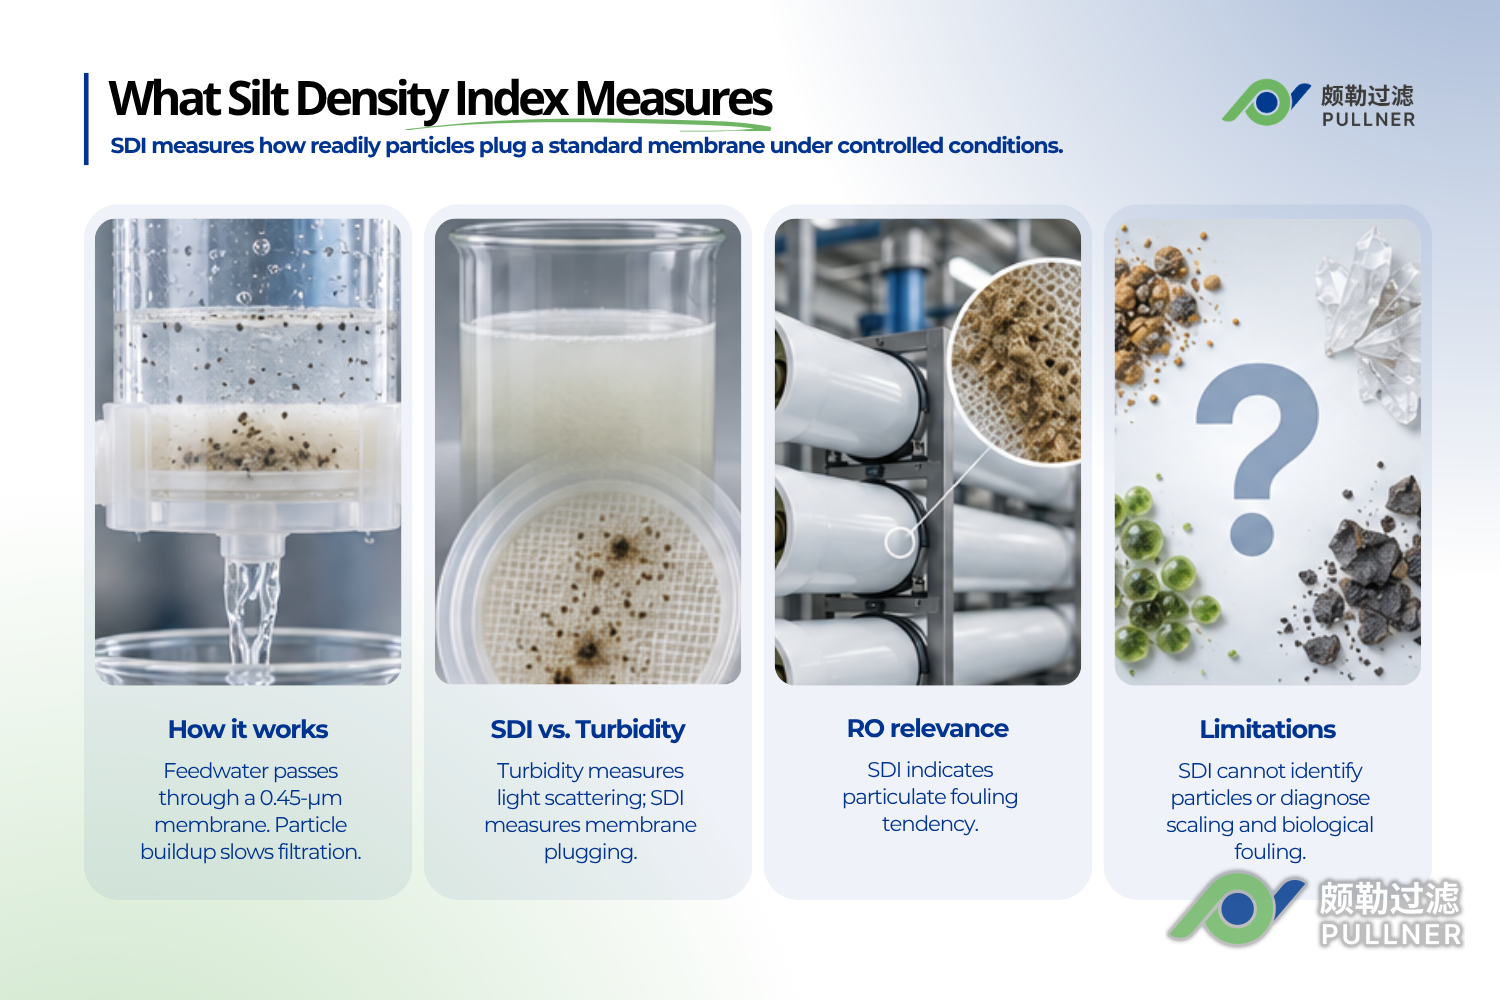
Silt Density Index (SDI) indicates how readily particulate matter plugs a standard membrane under controlled test conditions. Engineers use the result to compare feedwater samples and track changes across pretreatment stages. The value does not provide an absolute particle concentration.
Membrane plugging behavior
En ASTM D4189 measurement method passes feedwater through a 0.45-micrometer membrane at 207 kilopascals of constant applied gauge pressure. As retained particles reduce the available flow area, the time required to collect the same filtrate volume increases.
Differences between SDI and turbidity
Turbidity quantifies light scattering, whereas SDI records progressive flow restriction through a specified membrane. Low turbidity cannot confirm low plugging potential because fine colloids may scatter little light. SDI water testing adds a membrane-based view of feedwater quality.
Connection to particulate fouling tendency
For reverse osmosis (RO) systems, SDI serves as an empirical indicator of particulate fouling tendency. Particulate fouling can reduce RO performance as deposited material restricts transport across the membrane surface. Feed pressure and cleaning demand can rise as accumulation continues.
SDI can’t identify the retained material or diagnose every fouling mechanism. Scaling depends on dissolved-water chemistry, and biological fouling requires separate evidence. Differential-pressure trends and normalized permeate data provide the operating context needed for a fuller diagnosis.
How the ASTM D4189 Test Method Works
ASTM D4189 standardizes the membrane and pressure used to determine SDI. The method supports meaningful comparison only when operators control the equipment and sampling conditions. Small procedural differences can change the reported value.
Equipment required for an SDI test
The method uses a 0.45-micrometer membrane filter held at 207 kilopascals, or 30 psi, of constant applied gauge pressure. A pressure regulator, gauge, and suitable membrane holder maintain the required test conditions.
ASTM D4189 applies to relatively low-turbidity feedwater. The scope covers water below 1.0 NTU, including clarified effluent or filtered water. Most RO and ultrafiltration effluents fall outside the stated application.
Running the SDI test
Accurate SDI water testing starts with a flushed sampling line and an air-free assembly. Stable pressure keeps hydraulic variation from distorting the plugging measurement. A fresh membrane provides an uncontaminated starting condition for every test.
The procedure follows five sequential steps:
- Set the applied pressure: Adjust the regulator to 207 kilopascals, or 30 pounds per square inch, before timing begins.
- Measure the initial flow: Record the seconds required to collect the selected volume through the clean membrane.
- Continue filtration: Maintain constant pressure and unchanged sampling conditions throughout the chosen interval.
- Measure the final flow: Record the collection time for the same volume after the interval ends.
- Calculate the index: Convert the change in collection time into the SDI value for the reported interval.
Calculating SDI15
SDI15 converts the change in collection timing into a plugging-rate index across a 15-minute interval. The calculation uses the initial collection time, final collection time, and elapsed test interval:
- SDI = [1 − (initial collection time ÷ final collection time)] × 100 ÷ elapsed minutes
For an SDI15 result, the elapsed-time divisor equals 15. The final measurement records the time needed to collect the same filtrate volume after water has passed through the membrane.
Shorter valid measurements must retain their interval labels. An SDI5 or SDI10 result cannot be presented as SDI15 because each calculation uses a different elapsed time. Clear labeling prevents invalid comparisons across test records.
Maintaining consistent test conditions
Temperature and membrane selection can affect SDI comparability. Water temperature can change SDI results, and membranes from different manufacturers may respond differently. Engineers should document these variables when comparing results.
For trend monitoring, operators should keep the following conditions as consistent as practicable and document any changes:
- Sampling location: Use the same point when evaluating changes over time.
- Applied pressure: Maintain 207 kilopascals throughout each measurement.
- Collection volume: Use the same volume for the initial and final timing measurements.
- Water temperature: Record temperature so operators can identify results collected under different conditions.
- Membrane source: Document the manufacturer because membrane selection can affect comparability.
SDI15 Thresholds and What They Mean for RO Membrane Fouling Risk
SDI15 thresholds provide screening bands for particulate fouling tendency before water enters an RO train. They don’t create ASTM acceptance limits or replace the membrane supplier’s specification. Plant operating history determines how each band relates to actual system behavior.
Interpreting SDI15 values below 3
An SDI15 below 3 indicates slower plugging under the controlled test conditions. The result supports a lower particulate fouling concern for many RO applications. Repeated measurements must still confirm that feedwater remains stable through source or operating changes.
Values from 3 to 5 require closer review
An SDI15 from 3 to 5 indicates faster restriction of the test membrane and warrants closer pretreatment review. Designers should compare the result with the membrane supplier’s documented feedwater limit. Operators should check whether cartridge differential pressure changed during the same period.
Trend direction matters inside the range. A stable value near 3 presents a different operating condition than repeated movement toward 5. Sampling records can show whether seasonal intake changes or treatment adjustments caused the shift.
Values above 5 indicate rapid plugging
An SDI15 above 5 indicates rapid plugging at the sampling location. Operators should repeat the test under controlled conditions before changing the process. A confirmed high result directs investigation toward clarification and pretreatment filtration.
The response should focus on the stage responsible for particulate control. Media condition and backwash performance may require inspection before the cartridge stage. When upstream treatment remains stable, review cartridge installation and seal integrity.
Limits of SDI as a fouling indicator
The term “RO membrane fouling index” can imply broader coverage than SDI provides. SDI addresses particulate plugging tendency, but it does not quantify scaling or biological growth. Each fouling mechanism requires evidence matched to its cause.
Full-scale desalination data demonstrates the distinction. Dual-media filtration removed more than 80% of SDI15 at one seawater RO plant, but organic fouling indicators required separate monitoring. A broader data set prevents incomplete pretreatment decisions.
How SDI Fits Into Feedwater Pre-Treatment Decisions
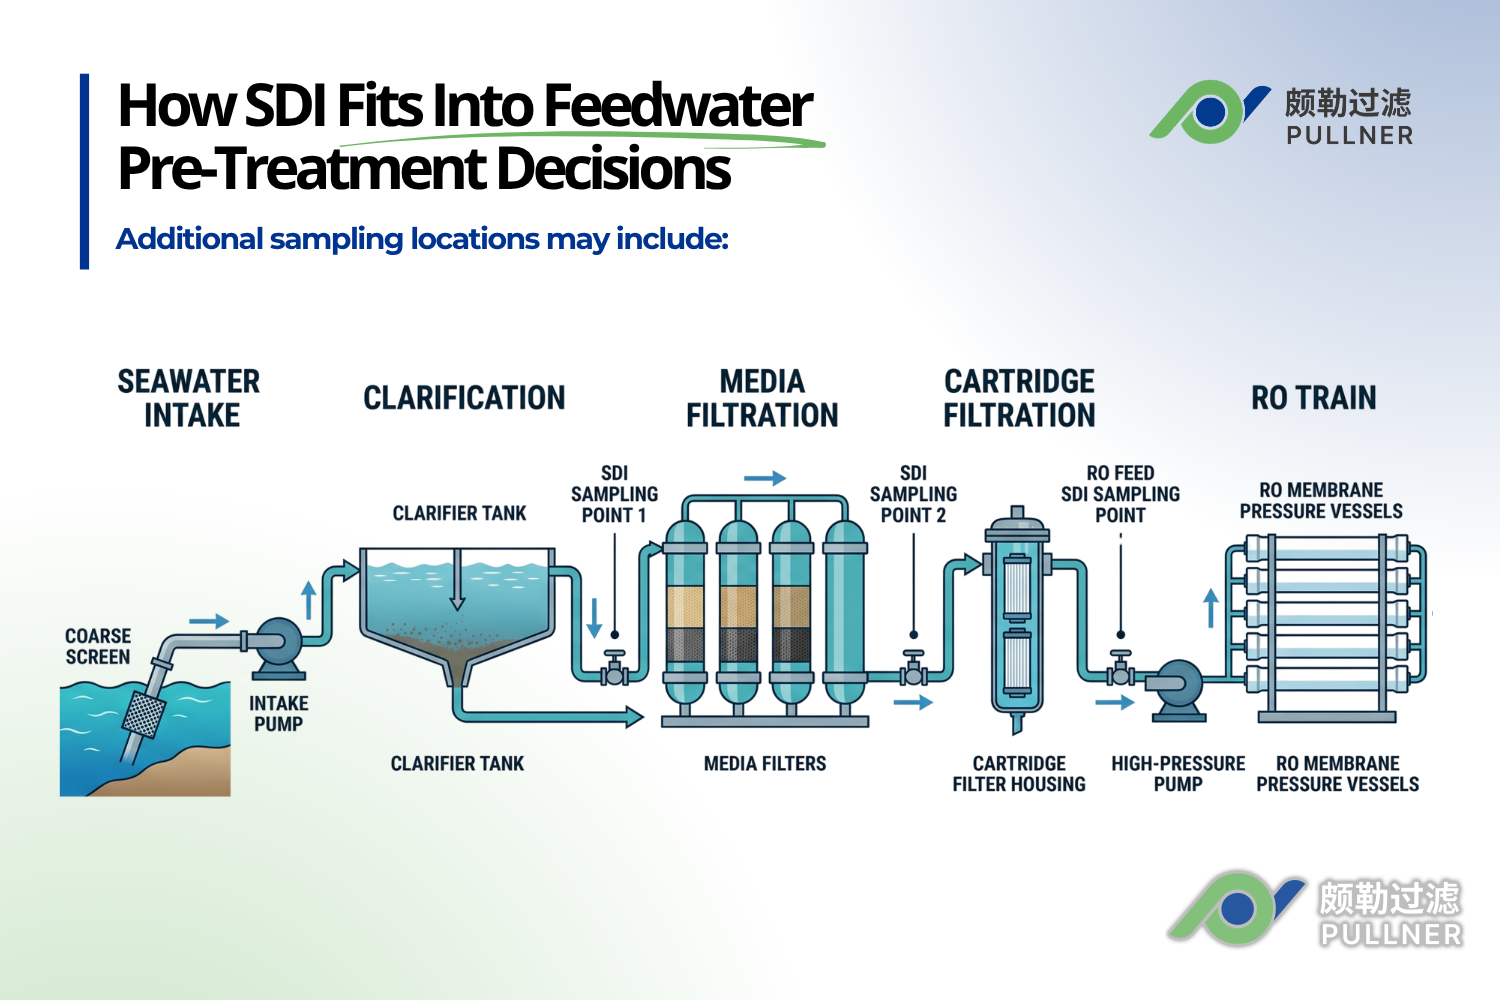
SDI testing at fixed sampling points can help identify where particulate plugging tendency changes before feedwater reaches the RO train. Measurements taken at fixed locations make each pretreatment stage visible in the operating record. Comparisons can help distinguish intake variability from changes in pretreatment performance when test conditions remain consistent.
Selecting SDI sampling points
One sampling point can follow clarification or media filtration in a desalination pretreatment train. A second can follow the cartridge security filters immediately before the RO feed header. Comparing results can show whether the final cartridge stage changes the feedwater’s particulate plugging tendency before the RO feed header.
Additional sampling locations may include:
- Raw-water intake: Establishes the particulate challenge entering the treatment system.
- Clarification outlet: Shows whether coagulation and solids separation reduced plugging potential.
- Media filter outlet: Identifies changes in granular filtration performance.
- Cartridge filter outlet: Records the final feed condition before the RO train.
Interpreting changes across the cartridge stage
The SDI pattern can direct the next stage of the pretreatment review:
- Falling SDI across the cartridge stage: Review cartridge differential pressure to determine whether the elements are carrying a substantial upstream load.
- Similar SDI before and after the cartridges: Review sampling consistency, element seating, seal condition, cartridge specification, and upstream feed conditions before changing the retention rating.
- Rising SDI after the cartridge stage: Check for contamination from the housing or sampling point, then repeat the test under stable conditions.
Using SDI results to guide pre-treatment selection
Pretreatment selection must reflect source-water behavior and the observed particulate challenge. Clarification can reduce incoming solids before media filtration. Cartridge filtration then protects the RO inlet from remaining material.
Variable seawater may justify a membrane barrier when conventional stages cannot maintain the required feed condition. Two-stage dual-media filtration delivered substantial particulate fouling reduction in a full-scale seawater RO facility. Measurements across both stages identified how pretreatment changed fouling potential.
Matching cartridge selection to the RO train
Cartridge selection begins with the target retention and system flow. Housing capacity determines the element format needed for the required throughput. Media compatibility narrows the choice according to feedwater chemistry and operating conditions.
Pullner's desalination plant filtration solutions place cartridge protection inside the wider RO pre-treatment sequence. A polypropylene pleated water filter cartridge can support security filtration when its specifications match the duty.
For systems with larger flow requirements, a high-flow seawater RO pre-filter provides another cartridge configuration. Engineers must confirm the required retention, housing fit, and operating conditions before selecting an element.
Feedwater quality for reverse osmosis depends on maintaining documented inlet conditions across expected source variations. SDI contributes evidence about particulate fouling tendency. Continued monitoring shows whether the installed pretreatment remains within the design basis.
How Pullner’s Lab Capability Connects to SDI Testing
Filtro Pullner operates as a technical partner in complete and custom filtration solutions. A common challenge after a high SDI result is knowing whether the problem sits in the feedwater itself or in the cartridge stage protecting it—a question a single SDI number can’t answer alone. Pullner’s laboratory capabilities address filtration questions that one SDI value can’t resolve, with each method supporting a separate part of the application review.
Particle analysis during an SDI investigation
Particle counting analysis can add information about particle counts that an SDI result doesn’t report directly. The results can support comparison across filtration stages when the sampling plan and test conditions are defined.
PMI pore size analysis examines the pore characteristics of filtration media. Engineers can compare those characteristics with the retention requirement when evaluating whether a filter configuration suits the identified particulate challenge.
Material testing for filtration decisions
Material compatibility testing assesses whether filter construction suits the process fluid and operating environment. Compatibility review matters before a plant conducts a filtration trial or approves a final specification.
For broader feedwater evaluation, Pullner uses ion chromatography and ICP-MS for anion/cation precipitation testing. The results examine water chemistry beyond the particulate plugging behavior represented by SDI.
Applying laboratory evidence to product selection
Pullner combines these laboratory capabilities with application requirements when reviewing filtration options, supporting decisions about media characteristics, material suitability, and cartridge configuration before product selection. For replacement applications, Pullner can be evaluated as a compatible option or second-source candidate, validated after a fit check, with dimensional review and operating validation still required before adoption.
Speak to the Filtration Expert
Pullner’s in-house lab—particle counting, PMI pore size analysis, material compatibility testing, ion chromatography, and ICP-MS—supports the evidence-gathering that sits alongside an SDI test, not a replacement for it.
Speak to a filtration expert about your SDI results and pretreatment operating data; Pullner can help connect laboratory findings with practical filtration requirements for your RO train.
Silt Density Index (SDI) Explained FAQs
What does the silt density index measure?
SDI measures how rapidly particulate matter plugs a specified 0.45-micrometer membrane under constant pressure. The result indicates particulate matter and correlates empirically with some equipment’s fouling tendency. It doesn’t report an absolute particle concentration.
How does an SDI test work?
An SDI test compares initial and final collection times through the specified membrane. The equation converts the change in flow capacity into a plugging-rate index for the selected interval. ASTM D4189 defines the applicable water and test-condition requirements.
Where does SDI water testing fit into feedwater assessment?
SDI water testing shows how particulate fouling tendency changes before water reaches the RO train. Repeated measurements at fixed locations can reveal an intake shift or pretreatment change. Operating data then shows whether the change affects system performance.
How should engineers interpret SDI15?
SDI15 identifies an SDI value calculated across a 15-minute interval. The number represents the test duration rather than a concentration unit. Shorter measurements must retain the corresponding SDI5 or SDI10 label.
Why do higher SDI results indicate greater fouling risk?
Higher SDI results reflect faster plugging of the test membrane and greater particulate fouling tendency. The relationship remains empirical instead of predictive. SDI cannot identify the foulant or calculate membrane service life.
How do SDI results inform pre-treatment decisions?
Comparing SDI before and after a treatment stage indicates whether that stage changes the water’s particulate plugging tendency. The result can direct attention toward upstream treatment or security filtration. Repeated measurements then show whether an adjustment improves control.
Volver arriba: Silt Density Index (SDI) Explained: Testing, Thresholds, and What it Means for Your RO Train
 English
  Spanish
  Arabic